
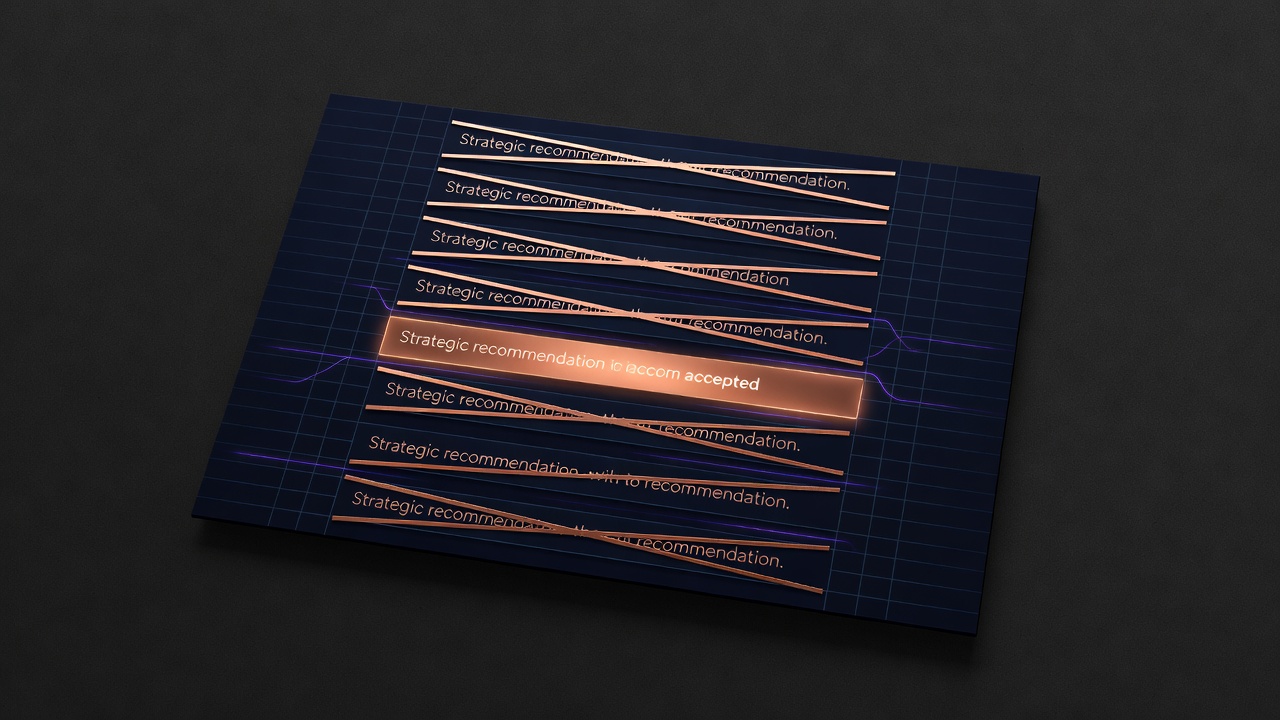
Override rates on model outputs track whether recommendations alter choices or simply sit beside unchanged behaviour.
Procurement teams still accept vendor dashboards that report prompt volumes and user logins as evidence of value. These numbers climb while the same sourcing thresholds and approval limits remain untouched.
The useful signal sits in the delta between model suggestion and final action. High override frequency on pricing or risk flags reveals either poor model calibration or deliberate human rejection of the logic.
Finance teams need to instrument the exact point where an override occurs and who authorised it. Without that timestamped record the board cannot separate theatre from any change in cash or margin.
Australian energy retailers already run procurement platforms that log every deviation from model-recommended contract terms. The resulting dataset shows whether the AI layer improved negotiation outcomes or merely added review steps.
Boards must replace adoption counts with two metrics: the percentage of outputs accepted without change and the measured variance in the variable the model was meant to improve. Everything else stays vanity reporting.
Teams that track overrides surface model drift early because repeated corrections expose when training data no longer matches current conditions. That data also tells procurement when to renegotiate or retire the licence.